")
Iain Miskimmin of Bentley Systems explains the value of an asset tagging strategy in assessing criticality, vulnerability and risk to ultimately inform better decision making
Since BIM was officially launched into the consciousness of the construction industry in the 2011 Government Construction Strategy and reinforced with the less well-known Government Soft Landings, most have come to realise that it is more than just a pretty 3D picture and understand that the value of information is dramatically increased when it is connected with other pieces of information to give us a truly holistic answer to our questions.
That connected information becomes more valuable again when it can be used for multiple purposes. During the six years of presenting at the Crossrail BIM Academy, I have had the privilege to interact with and brainstorm with 5,500 of the world’s digital professionals and one piece of methodology, taken originally from the oil and gas industry, reused by Crossrail and repeated many times around the world, has stood out.
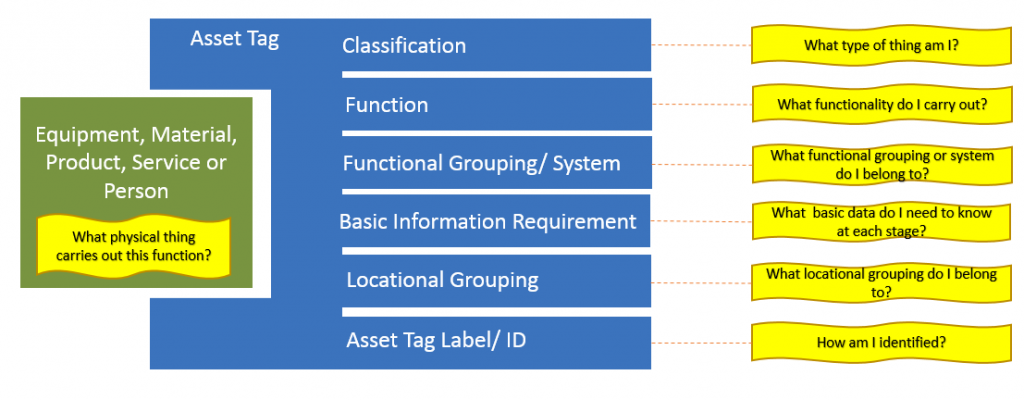
An asset tagging strategy is not just for labelling things (which is the common misconception) but there to record basic information allowing the duty and function to be recorded. It has also become clear that the information recorded can be reused to help inform us of the criticality, vulnerability and risk to our assets.
From our Government Soft Landings documentation, we know that is it correct to set an outcome-driven goal and that outcome can be achieved through a set of functions (not products), so I will take you through an example from outcome to risk
For this example, I will take information freely available from the internet. I have picked an organisation we all know well, one that owns a significantly high number of assets and has to constantly prioritise their funding towards those assets that are critical to delivering their defined outcomes.
Outcomes
- Free flowing – Where routine delays are infrequent and journeys are reliable safe and serviceable – where no one should be harmed when travelling or working.
- Accessible and integrated – So people are free to choose their mode of transport and can move safely across and alongside our roads.
- Support economic growth with a modern and reliable road network that reduces delays, creates jobs, helps business and opens up new areas for development.
- Ensure our activities result in a long-term and sustainable benefit to the environment.
 Functions
Taking the first outcome and applying it to a high-level asset such as a junction, its basic function should be to “allow the smooth flow of traffic from one road to another”. The junction, in turn, is made up of many primary function units (PFU), one of which is a bridge. This asset’s basic function is to “allow one road to cross another”. The bridge is split into functional units (FU), one of which is a lane with a basic function of “allow northbound traffic across the bridge”. Finally, we get down to one of the individual assets, the crash barrier with a basic function of “stop northbound traffic leaving the bridge and impacting on the road below”.
Now there are almost 88,000 highway bridges in the UK, with over 12,000 of them belonging to the organisation in question. Which ones should have a priority when it comes to funding? How do we know they are critical? How vulnerable are the critical ones, what is the risk and how do we mitigate this?
Criticality
What do we define as critical when looking at our national infrastructure in the UK?
- Those networks, systems and assets necessary to maintain society and enable life.
- UK defines 10 critical sectors, including electricity, water supply, energy (oil, gas, etc), finance and food.
- Significant impact on GDP.
- Largely privately-owned, commercial enterprises, but consequences of failure are of national significance.
- Vital to UK resilience.
To help us work out the criticality, three pieces of information from the asset tagging strategy can be used:
Function
What function does the asset carry out? How vital is it to achieving the desired outcomes?
Functional grouping
What Primary Functional Unit or Functional Unit does the asset belong to? The obvious ones are the physical assets, but when looking at this, we need to look at not only the asset breakdown structure but also the economic, environmental and political relationships.
For example, is this bridge the sole access to an industrial estate, vital to the local economy or to an important government location? Is the only way around it a long diversion, adding to both the environmental and social impact?
Locational grouping
When looking at the location of our assets in this context, it should not only understand where they are in the network, but also geographically, taking into account the size of the population it supports and the GDP that they create.
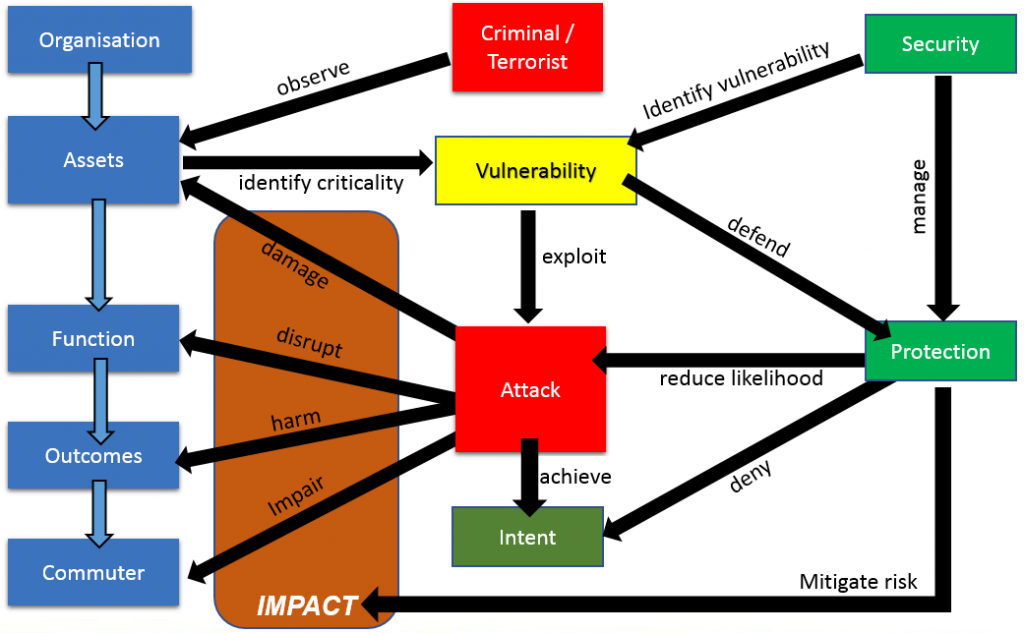
 Vulnerability
It is important when we look at our infrastructure assets that we understand how vulnerable they might be. Once again, information from the asset tagging strategy can be reused to help inform us.
Classification
Firstly, an understanding about what type of thing the asset is. A concrete slab is less vulnerable than a delicate sensor or camera system.
Basic information
The basic information we gather about the asset should be able to answer questions about any weaknesses in it, or the system it belongs to. Such as its height off the ground, IP rating and the materials it is made from.
Location grouping
Once again, the location is important. An asset in a public area is more vulnerable than one in a closed off, private area.
Likelihood, impact and consequence
The basic information we have recorded in the asset tagging strategy will also help us to determine whether the likelihood falls in the probabilistic or deterministic categories. It will also lead us to understand the impact and consequence if the asset is successfully attacked through criminal or terrorist means.
- Will it cause damage to property, profits, social licence or civic pride?
- Will the disruption cause inconvenience to the asset users, or potentially the GDP of the country?
- Will it harm the end user, causing, deaths, illness or pollution?
Will it impair the profitability, share price, reputation, regulation and ultimately existence of the owner?
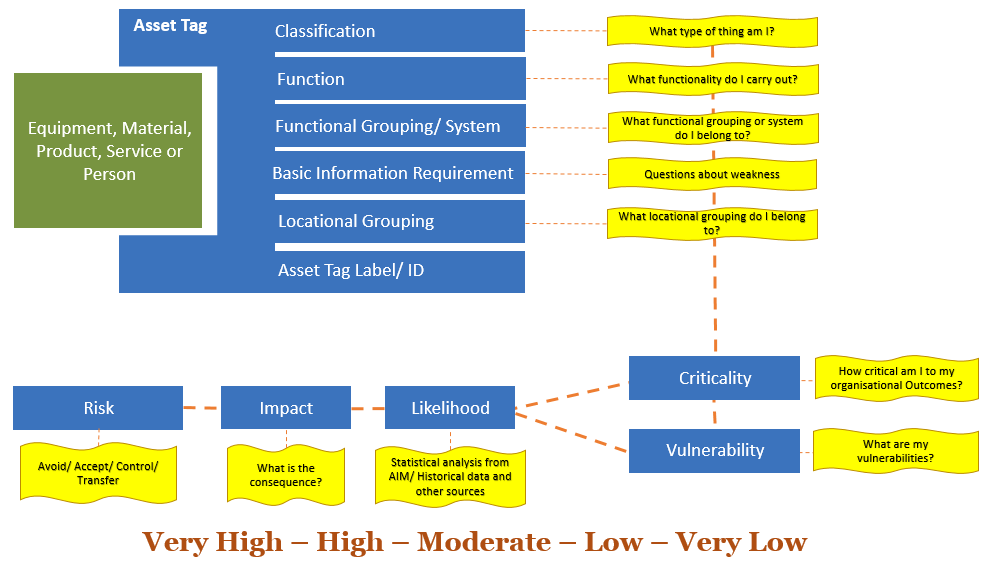 Risk and treatment
When talking to many of the academy attendees over the years, the majority have opted to measure the risk to their assets in words rather than numbers to help avoid misunderstandings, so recording them as anywhere between ‘very high’ and ‘very low’ will help us to work out what treatment needs to be done.
Avoid/Remove/Terminate
It is recommended that we start our collection of information and our asset tagging strategy when we first imagine a need. This activity can then help us to design out that risk or perhaps remove the point of failure in the functions defined in the first place.
Accept/Tolerate/Retain
Not an easy thing to do, but sometimes the only course open to us is to accept the consequences and perhaps gamble on the likelihood?
Control/Reduce/Mitigate
With the correct information at hand, we can lessen the impact or likelihood and put both active and passive measures in place.
Transfer
Finally, we can choose to insure the risk out and potentially transfer the ownership of the risk entirely.
Summary
In all of this analysis, getting information early is key. The sooner we start gathering the basic information demanded by an asset tagging strategy, the more options we have to avoid the risk in the first place. Key information in this is the asset breakdown structure (Functional groupings) so we know the impact this asset has on others, the location, allowing us to understand its importance and the function supporting the Outcomes.
- Criticality helps us understand how much time, effort and money ought to be invested.
- Vulnerability will define the level of protection we need to apply.
- Likelihood can be gained through statistical analysis of our AIM and other connected data.
Thus, we can make a better decision to either avoid, accept, control or transfer the risk.
Iain Miskimmin
Digital Asset Advisor/Director BIM
Advancement Academies
Bentley Systems UK
Tel: +44 (0)207 861 0900
Twitter: @bentleysystems
Facebook: @BentleySystems


Evolution: Advancing digital twins in the AEC/O industry")


