BIM and GIS are often thought of as separate tools for separate professions and never the twain shall meet. Mike Shilton, Product Director at Keysoft Solutions and Chair of the Landscape Institute Digital Practice Group, looks at how the two can work together
There has been a long-held belief that GIS is a tool that has little to do with design and construction processes and is confined to the domain of planning and site management professionals. Likewise, CAD applications and now “BIM software” (if there is such a thing!) are not to be used by anyone other than designers, contractors and asset managers.
“I do GIS” or “I do BIM” has been the norm over the years and only helps to divide people into two distinct camps. However, BIM and GIS have a strong common bond, the “I” (Information) in both. While each tackle the “I” in different ways, they are both just tools to create, manage and edit data. Yes, they do this differently to meet the differing demands of their users but this is no different to text being shared as TXT files or spreadsheets as CSV files. The tool you use to view and edit the content may change but the underlying data is still the same.
How does, or can, GIS and BIM work together? First, we need to understand what they are. Let’s start with GIS. In literal terms, it is a tool that allows you to create, view, edit, interrogate and analyse data that is attached to geographical representations of objects, where they exist in the real world; that is, georeferenced graphical and non-graphical data. I prefer to refer to this as spatially referenced data and at the Landscape Institute, we now have a Spatial Data Workstream that seeks to provide advice on these matters.
So, what about BIM? When we design a new facility or landscape, we create a 2D or 3D model, as appropriate, that is graphically rich with specification and product information attached to the objects and that will be located in the real world; that is, spatially located data. Is there a connection here? In simple terms, one (GIS) IS georeferenced geometry with data attached to describe it, the other (BIM) is geometry that WILL be spatially located with data that describes it.
Within a spatial data system there are three basic geometrical elements: points, linear features and polygons, plus annotation text. They perform as placeholders for appropriate information about the type of object being described, so a point shows the location of a specific feature, such as a bollard, bench, or even a structure, such as a gazebo. For this reason, I prefer to refer to these as an instance.
A linear feature may represent a fence, a wall, a road centre line or a more complex network, such as a drainage system, and may include points at the intersections, where posts and manholes may be located. A polygon represents area-based objects, such as buildings, plots of land, water areas and roads. In general, these three geometry types tend to be graphically simple so they remain lightweight and easy to manage over large areas.
 Within a BIM model, we generally show objects more graphically rich but they are still based on either an instance feature, for example the insertion point of a tree, a linear feature or polygonal area. Traditionally, we have used the graphics to describe the object by its appearance, so we draw a bench as a bench, we draw walls with foundations and copings and colour grass as green stipples. We can enhance this further by adding materials to emphasise the elements for rendering. However, with the rapid need to describe features better, we are now attaching extended data to the object, such as specifications, product information and maintenance requirements.
One of the increasing benefits of working within a BIM environment is the ability to run clash detections between objects and use the data associated to an object to highlight it or change its display to answer a question, for instance: “Show me all the trees that that may clash with underground water mains”. This query-based analysis is a major strength of a geospatial system, where you can change the graphical representation of a feature to answer a question, for instance: “Show all the trees that need watering as a red circle of a specified diameter”, where it will use the point and the data associated to this to determine which trees are to be shown as red circles. As you can see, the commonality is increasing!
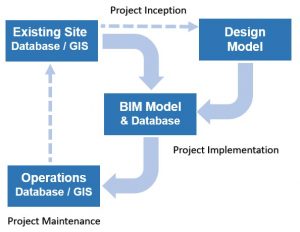
Let’s see how the two may work together. The starting point of any project is to bring together existing information about the site to begin the decision-making process, including location, topology, geology, context, environmental data, habitat, ecology and property information. Most of this data is held within geospatial systems or databases, so GIS is a useful tool for aggregating this, allowing us to run queries to find features or identify the interaction between them and present this analysis in a meaningful way.
If we can bring this geometry and data into a BIM model, currently via import and exports, we can quickly see the impact of our proposals. During the design and construction of our project, we still need to check the model for clashes and compliance to the BIM Execution Plan (BEP) via data drops. This can be tested within spatial databases or BIM clash detection tools and changes fed back to the design and implementation team to make the necessary adjustments. When the facility is complete, it is most likely that the information will need to sit in a database or spatial system that is graphically lightweight, so data can be retrieved quickly.
As we move towards BIM Level 3, digital cities, the Internet of Things and Big Data, the boundaries that exist between BIM and GIS will become increasingly blurred, or should I say integrated. We can already see improved links between the virtual world and real world with the rapid advancements in consumer applications, such as Google Earth, where you can locate and view a site with 3D photorealistic renderings of building facades, ground materials and even existing trees. Indeed, applications now allow us to capture the ground form and basic entities to bring into CAD or GIS. It will not hard to see that we will begin to be able to view and use the data attached to the objects for planning and commercial purposes.
We are currently collecting and creating more data than ever before and this is growing exponentially. Our ability to use Big Data and its interconnectedness will become an increasingly critical part of the decision-making process, especially if we are to find solutions for the challenges of the future, such as population growth, environmental change, urbanisation, demands for food and water and managing finite resources. The ability to view and analyse data, rather than the tool we use, will be at the heart of the decision process so “Information” will become king.
Mike Shilton
Chair
Landscape Institute Digital Practice Group
Tel: +44 (0)207 685 2640
Twitter: @talklandscape


