
The Sustainability Dashboard, released with Vectorworks 2026, gives you instant, real-time insight into your project’s environmental performance so you can make confident decisions as your project progresses
Achieving sustainability goals in design projects shouldn’t be a guessing game.
The Sustainability Dashboard automatically aggregates data from your design model, tracking four critical sustainability markers — Embodied Carbon, Urban Greening Factor (UGF), Biomass Density, and Biodiversity Net Gain (BNG) — all updated as your design evolves.
With the new dashboard, you can stay ahead of regulations, avoid costly late-stage revisions, and more reliably deliver compliant projects. The result: smarter, more resilient designs that demonstrate your commitment to sustainable excellence.
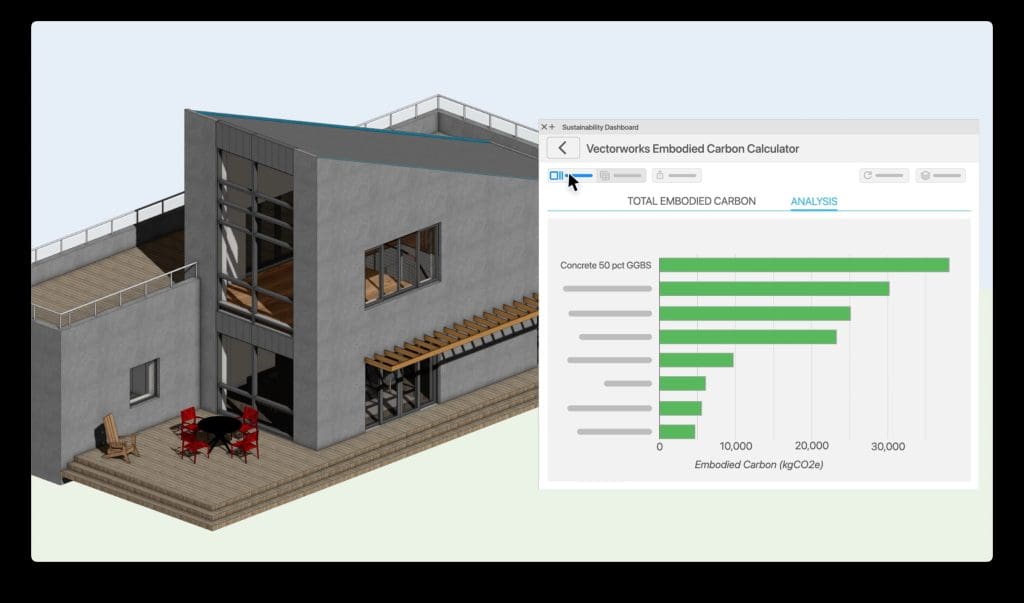
Vectorworks Embodied Carbon Calculator (VECC)
The Vectorworks Embodied Carbon Calculator (VECC) is designed to calculate, visualize, and report a project’s embodied carbon footprint directly from your building information model (BIM). It automates carbon assessments while offering detailed control over material choices and lifecycle analysis. Linking material data, life-cycle stages, and carbon metrics empowers you to optimize sustainability outcomes and align with key industry standards such as the AIA and RIBA 2030 climate challenges.
With real-time feedback, you can instantly see how design choices impact embodied carbon emissions, helping you make data-driven decisions that reduce negative environmental impact and improve performance. VECC turns what was once a complex calculation into an intuitive, actionable process, encouraging sustainability to be integral, not incidental, to your design workflow.
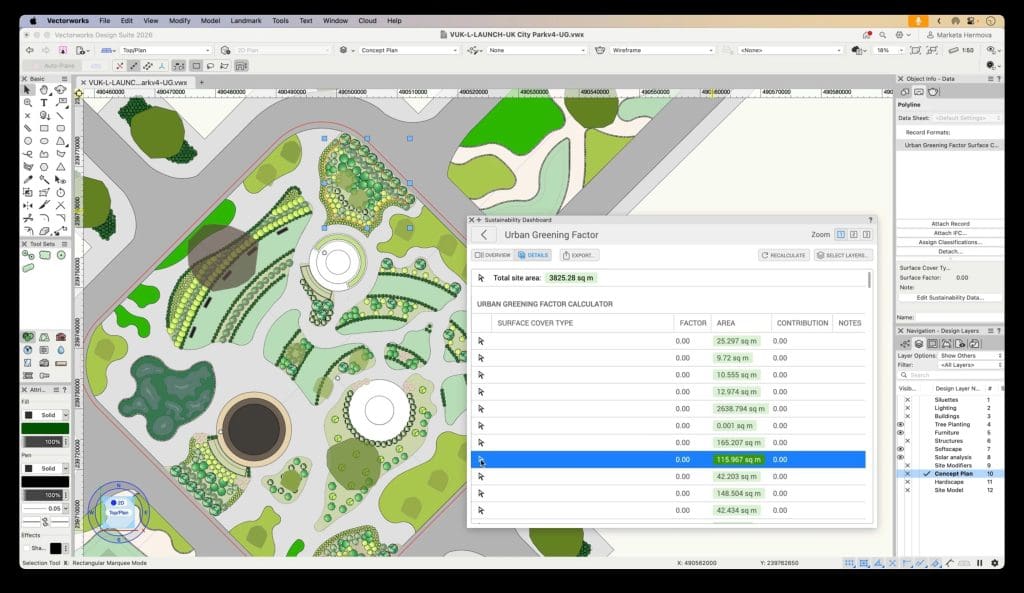
Urban Green Factor FACTOR (UGF)
The Urban Greening Factor (UGF) framework helps you to calculate, monitor, and evaluate the quantity and quality of green infrastructure in developments, as required by the London Plan Policy. The Sustainability Dashboard not only tracks your project’s UGF score, but it also provides a dynamic, interactive way to input data and test surface cover types. The tool integrates seamlessly with BIM workflows, automating surface analysis and generating detailed metrics that break down coverage by type.
Visualizing and quantifying greening strategies early in the design process means you can achieve compliance with local planning and sustainability standards, such as those in London, while optimizing site layouts for environmental performance. UGF calculation becomes fast, transparent, and collaborative with the Sustainability Dashboard, empowering your team to make confident design decisions right from concept.
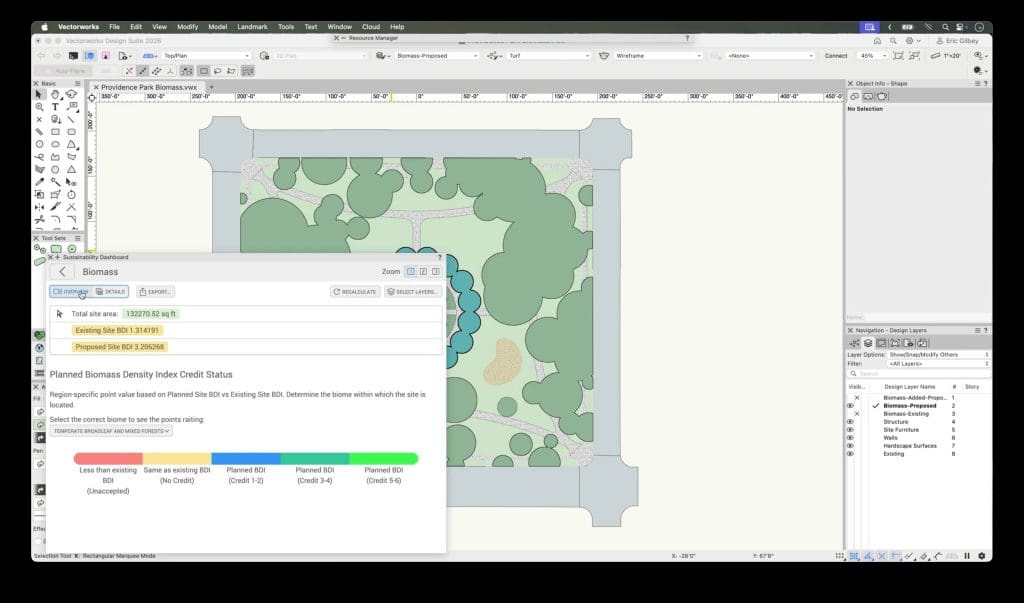
Biomass Density
The Sustainability Dashboard lets you track biomass density index in landscape projects, detailing both the existing and proposed vegetation features within site boundaries. It allows you to delineate and assign credit values to various land cover types — such as tree masses, lawns, paved areas, and proposed vegetation — by converting mapped shapes into smart design objects.
The approach integrates quantitative measures for monitoring gains, with each addition of vegetative cover impacting the overall sustainability score. With this tool, you can evaluate compliance in real-time and demonstrate the impact of designs on biomass density.
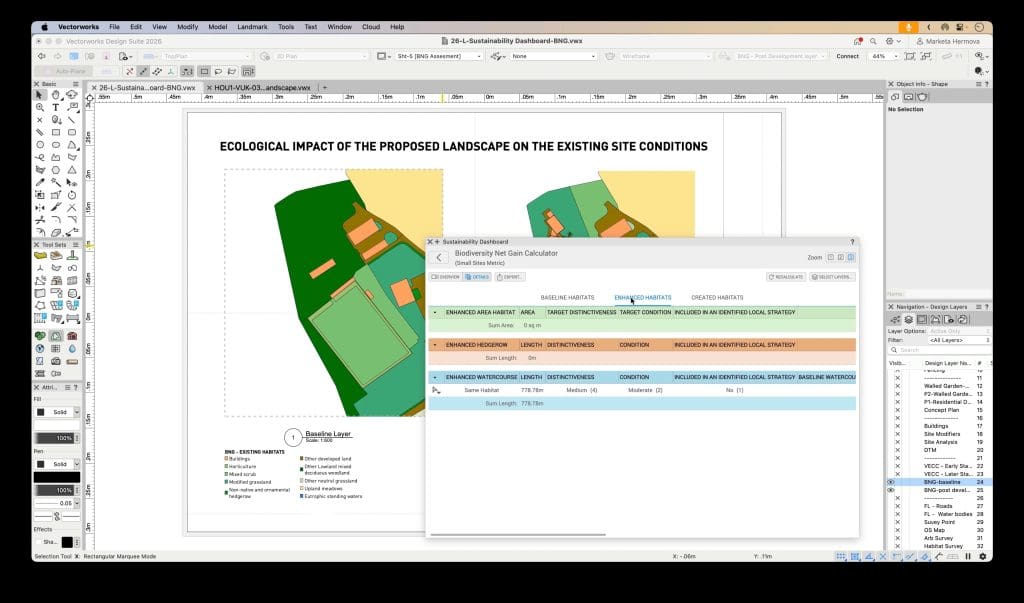
Biodiversity Net Gain (BNG)
The Biodiversity Net Gain (BNG) module in the Sustainability Dashboard focuses on protecting and enhancing biodiversity within design projects by giving you access to the pertinent information and facilitating collaboration between designers and ecologists.
Habitat areas, hedgerows, and watercourses are tracked and quantified. The system supports multiple survey formats and classification standards, making it adaptable across different project types and compliance frameworks.
Building the future of sustainable design
The Sustainability Dashboard is the central hub for sustainable design workflows in Vectorworks software. With the tracking tools in VECC, UGF, Biomass, and BNG working in unison, it provides the data clarity and control you need to design with purpose and precision.
And this is just the beginning. More tools and capabilities will be added over time, expanding what’s possible in sustainable design. We invite you to share your ideas and suggestions through our roadmap — and help shape the next generation of design technology that leads toward a more sustainable built environment.
See what else is new in Vectorworks 2026


 in building: Enter the new era of transformation")


