New UK property transaction statistics have been released by the government, showing a decline in transactions across the residential and non-residential sectors
The property transaction statistics are based upon records by HMRC, Revenue Scotland and the Welsh Revenue Authority (WRA) for Stamp Duty Land Tax (SDLT), Land and Buildings Transaction Tax (LBTT) and Land Transaction Tax (LTT).
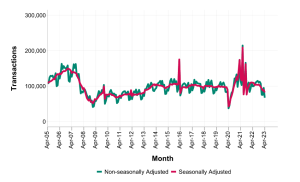
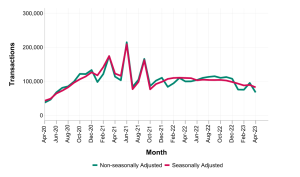
The latest statistics give details about property transactions in the UK over the past three years. It includes both residential and non-residential transactions and provides adjusted and non-adjusted estimates to show any patterns or trends in the data.
Both the residential and non-residential sectors have been affected
After an increase in property transactions in March, the downward trend in non-seasonally adjusted transaction levels in the residential and non-residential sectors has returned. Seasonally adjusted figures have also reverted to their downward trajectory.
The number of property transactions in April dropped significantly compared to March. This was because March was the final month for completing purchases under the government’s Help to Buy Equity Loan Scheme, resulting in higher transaction numbers.
From January to March 2023, residential transactions were slightly lower than pre-coronavirus levels. There was a total of 270,000 transactions during this period, compared to 283,540 in 2020. It’s worth noting that April is not included in this comparison because transactions were significantly affected by the pandemic in April 2020.
These trends can be seen in the graph below:
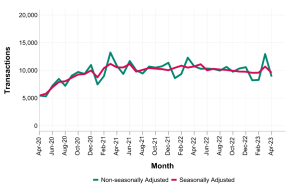
Non-residential transaction numbers have dropped once again. However, the seasonally adjusted figures for April, at 9,570 transactions, remain higher than the low of 9,550 in January and are only slightly below February’s 9,580 transactions.
Last year, property transactions saw significant declines during April and May due to the impact of the coronavirus. Following this period, non-residential transactions gradually increased for a few months before stabilising.
These trends are shown in the graph below:
Nil rate bands led to previous increases in transactions
In 2021, there were significant spikes in property transactions during March, June, and September. These peaks were primarily driven by more taxpayers capitalising on temporary increases in nil rate bands of SDLT, LBTT, and LTT.
However, during the second quarter of 2020, the coronavirus pandemic led to substantial declines in property transactions.
In March 2016, there was a significant surge in property transactions as taxpayers rushed to complete them before higher rates for additional residential properties were introduced in April 2016.
In December 2009, there was an unusual peak in transactions due to the expiration of a temporarily increased nil rate band for residential transactions.
The decline in transactions starting from late 2007 was concurrent with the financial crisis. Prior to that, transactions had been steadily increasing, reaching a peak in mid-2006.
These trends can be seen in the graph below: